
Adding Textual Data on Financial Valuation Task
Unfortunately, the project repository is not accessible publicly. However, I will provide a project summary with respecting the research work our partners doing from UBC Sauder School of Business.
Collaborators:
Brief Introduction
In this project, several techniques are used to combine financial data and text data as features to study firm performance. To determine firm performance, we consider it as a discrete problem and label the data using stock price as a proxy for firm performance. For financial data, we have used the features from the following sources: balance sheet, income statement, and statement of cashflows, as well as several new features obtained by computing fundamental financial metrics such as P/E, EV/EBITDA, Debt to Equity Ratio and Profit Margin.
With text data, the SEC form 10-K(annual reports) are the main focus of this project. Topics and different sentiment features (positivity, certainty, polarity) from some specific items are extracted as new features. Using these features, more insights into the performance of U.S. companies over the period from 1995 to 2017 have been obtained.
Data
The datasets are the U.S. Securities and Exchange Commission (SEC) fillings, Wharton financial fundamental data, and stock price history. These 3 main data sources are required to run the analysis. All other data needed can be created from these sources. The first is a MongoDB server containing parsed 10-K filings as was provided by Sauder School of Business, and the second is the Compustat and CRSP datasets from Wharton Research Data Services. Finally, we used a SQL database containing metadata regarding the SEC filings for textual data.
Objectives
- Extract useful features from both numeric and textual dataset
- Develop a modular pipeline that can be used in our partners future research projects.
- Apply predictive models to demonstrate usefulness of extracted features
- Iterate the step one and three to improve features and predictive model selected.
Procedure and Products Delivered
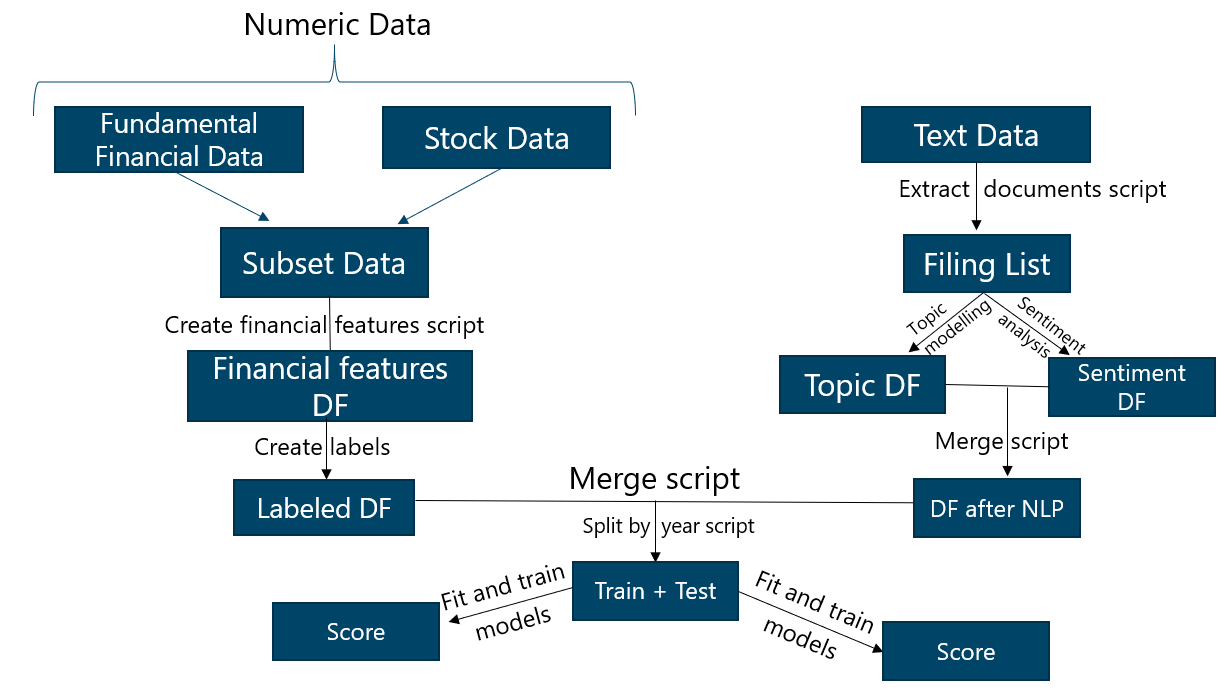
1. Data Pipeline
A overview of the pipeline can be seen below:
2. Feature extraction
For feature extraction; EDA, data wrangling and visualization methods are the techniques that have been used to gain insights from text and numeric data. As financial expert in the house, I have gathered features for fundamental financial analysis based on discounted cashflow analysis. P/E, EV/EBITDA, Debt to Equity Ratio and Profit Margin are some of examples for the metrics used.
Natural Language Processing
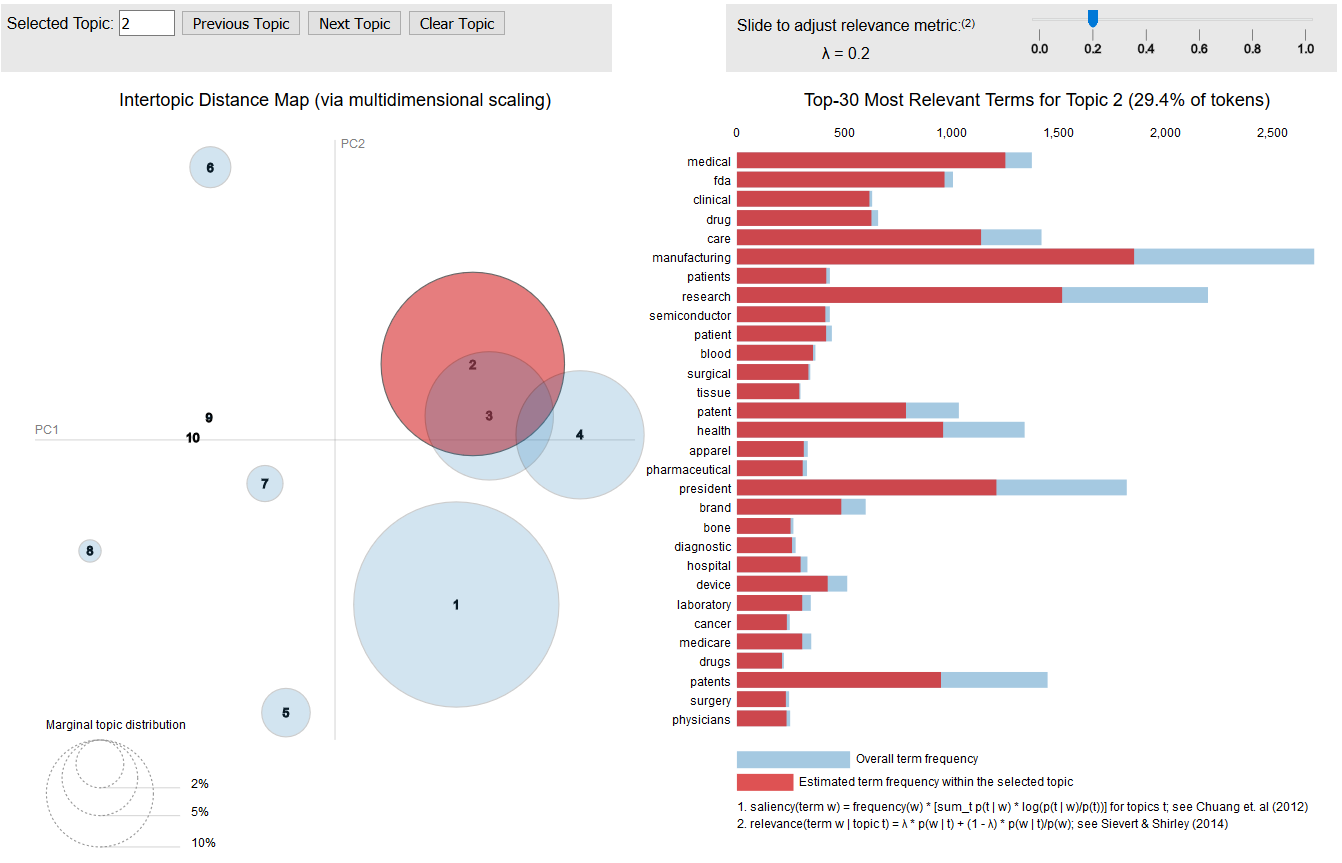
Topic Analysis LDA, and NMF are the methods used to experiment and model the topics found in some specific sections from the SEC filings.
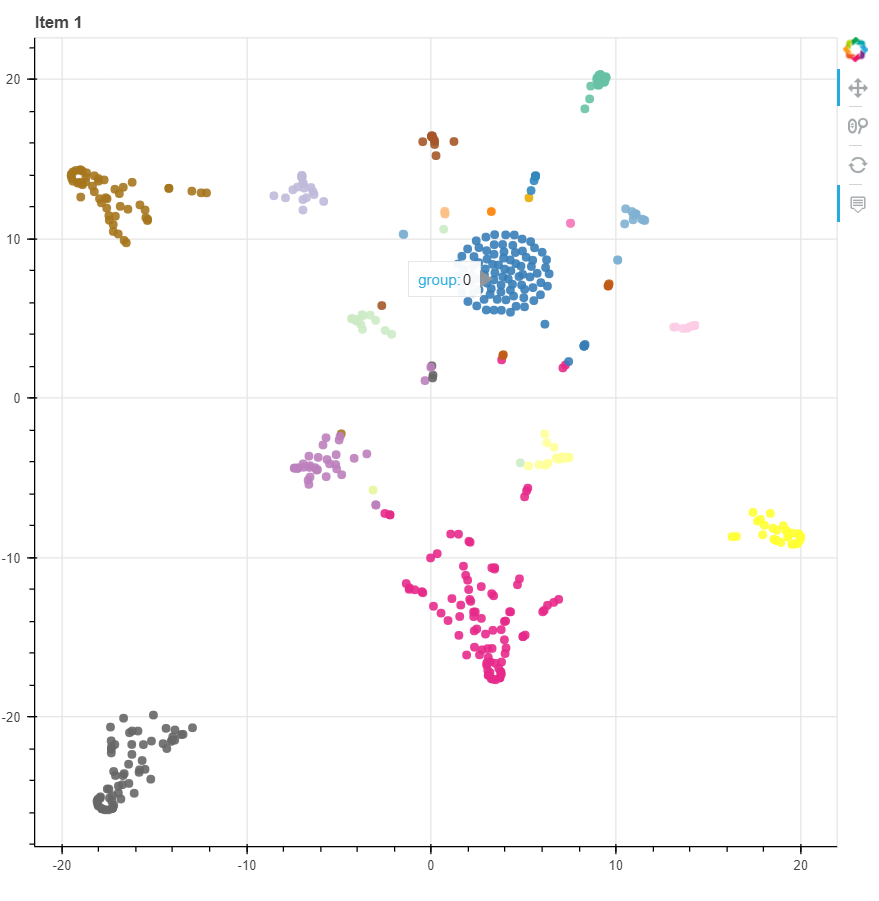
Word distribution testing with 10 topics: Below is the word distribution of CV-LDA with 1000 filings. The selected topic is topic 2 - medical.
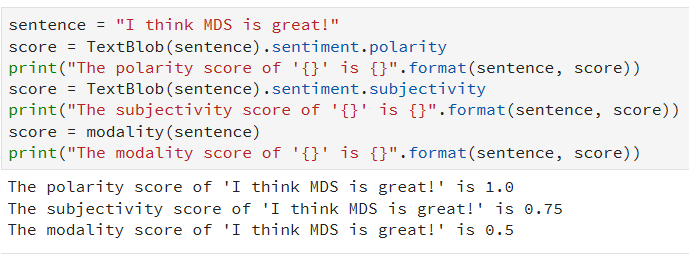
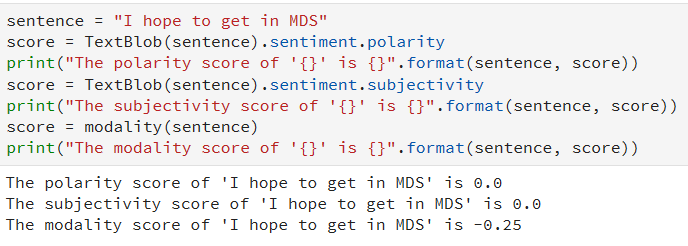
Sentiment Analysis Polarity, subjectivity and certainty scores are extracted in some specific sections from the SEC filings.
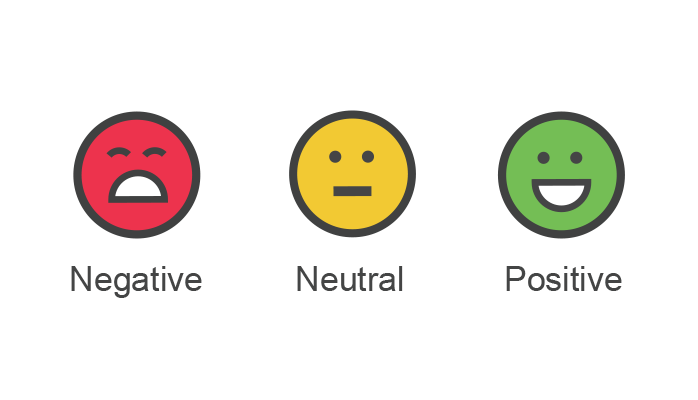
Examples can be seen as below:
3. Predictive Models
The predictive models were delivered as a set of scripts that enable researchers to run any type of predictive model to assess the usefulness of the new extracted features. These models have been tuned to use the financial features using grid search in order to find the best hyper-parameters. k-Nearest neighbours, Logistic Regression, Random Forest Classifier, SVM, and Feed Forward Neural Network are the models used in the project.
Conclusion
I will skip sharing results not to overshare due to respect to the partners. What I can say is that the predictive models with textual features showed a slight improvement of predictive power over the base financial features. By the help of pipeline, new projects can be experimented fast.