
Wine Selector RShiny App (Part I)
Let’s build a R-Shiny dashboard for a tasty subject :) Wine!
Can’t you wait for reading all the story?I leave the dashboard link here for you :)
Background
Imagine you prepared a delicious dinner and you want to buy the perfect wine for your dinner. Normally, you go to the liquor store, and you have no clue what you should buy. You look at the shapes the bottles, the origin of the country, read the description, and maybe the year. You know the older the wine the better wine. But, what about the cost? You cannot afford to buy expensive wines. Yes, my app is here for you! Be happy, you will find the best option for you. You can read the reviews of the wines for your budget. If you know which type is of wine is your favourite you can summarize and find similar wines. Even more, you can also use your wine knowledge everywhere. Everyone will think what a wine expert you are!
Planning
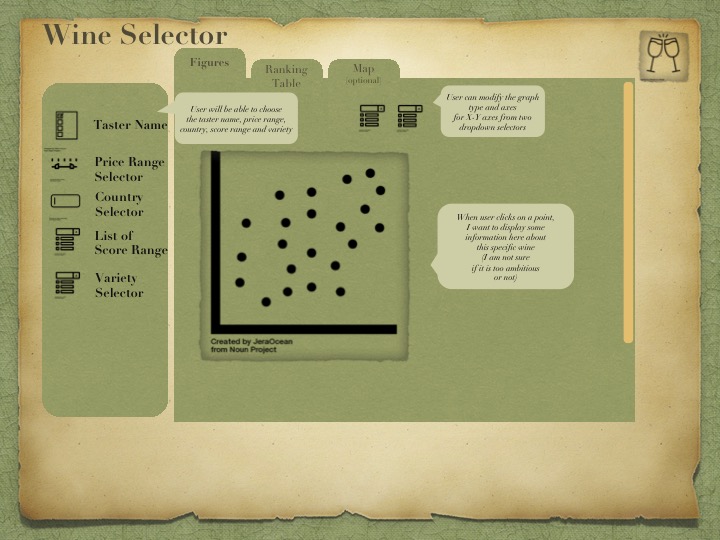
There will be three sections in the dashboard app and First Figure shows the first section “Figures”. User needs to select ‘Taster Name’ from checklist and also can multi-select from taster name list, ‘Price Range Selector’ from slider, type country name in ‘Country Selector’ and with autocomplete function suggestion country names will appear in the text box, select score range from ‘List of Score Range’ drop-down list and variety from ‘Variety Selector’ drop-down list. The user can add one filter or more than one filters from the left and according to user’s filters and data result will be shown in the graph in the right side. The user can modify the graph type and axes for X and Y axes from two drop-down lists.
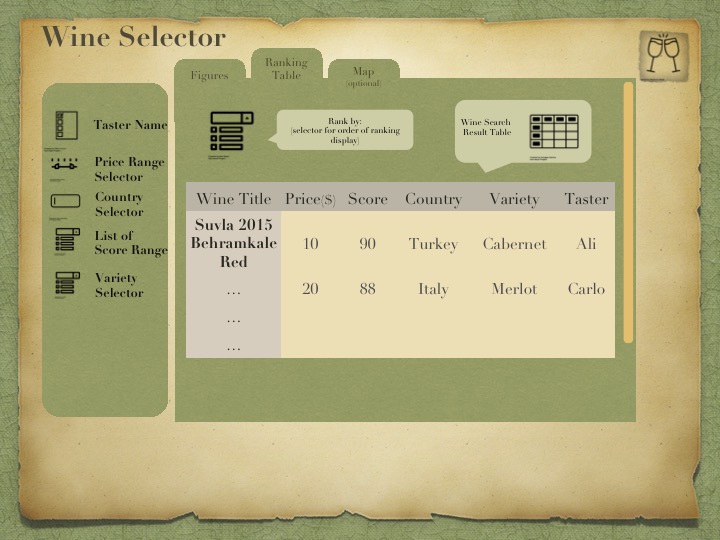
Second Figure shows the second section “Ranking Table”. User needs to select ‘Taster Name’ from checklist and also can multi select from taster name list, ‘Price Range Selector’ from slider, type country name in ‘Country Selector’ and with auto complete function suggestion country names will appear in the text box, select score range from ‘List of Score Range’ drop down list and variety from ‘Variety Selector’ drop down list in order to see which wines are the best options according to the criterias user selected, wine titles will be listed in the first column (Wine Title) of the table. The user can add one filter or more than one filters from the left and according to user’s filters and data result will be shown in grid view (table) in the right side. The table contains wine title, price, score, country, variety and taster information.
Third Figure demonstrates the third section “Map”. It is the fact that this map section might be too ambitious, so I would like to propose this section as an optional part if time permits. I want to add map section because I want to make it user-friendlier and more visual.
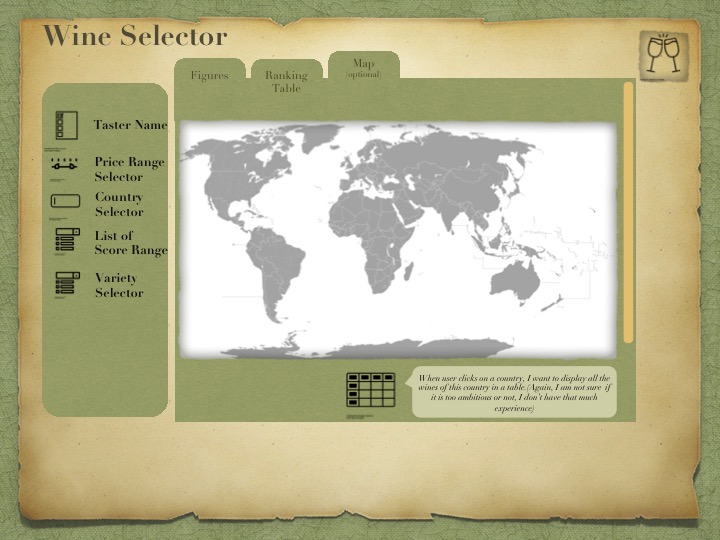
User needs to select a point on the map to choose the country and then add filter from left side with selecting ‘Taster Name’ from checklist and also multi selecting from taster name list, ‘Price Range Selector’ from slider, typing country name in ‘Country Selector’ and with auto-complete function suggestion country names will appear in the text box, selecting score range from ‘List of Score Range’ drop-down list and variety from ‘Variety Selector’ drop-down list. Later on, according to user’s filters, all wines of this country will be displayed in a table below the map. The table contains wine title, price, score, country, variety and taster information.
That’s enough of planing. Let’s build the dashboard on Part II. You’ll be surprised how well actual dashboard looks compare to sketches!